
OpenTelemetry, Python & Honeycomb: Setting Up Alerts
And how to make sure they're meaninful

I've introduced a little bit about how to set up OTEL in a Python's API in a previous post.
Now it's time to figure out how to use this data we're sending to have useful alerts - not just dashboards, since no one wants to go insane refreshing them all the time.
So here's what I learned about configuring alerts effectively over a few years of banging my head against the keyboard whenever I had a false positive. This will keep on using Honeycomb as an example - but for a future post, I wanna show how OTEL itself makes it incredibly easy for us to send observability data to another tool!
Creating Targeted Alerts
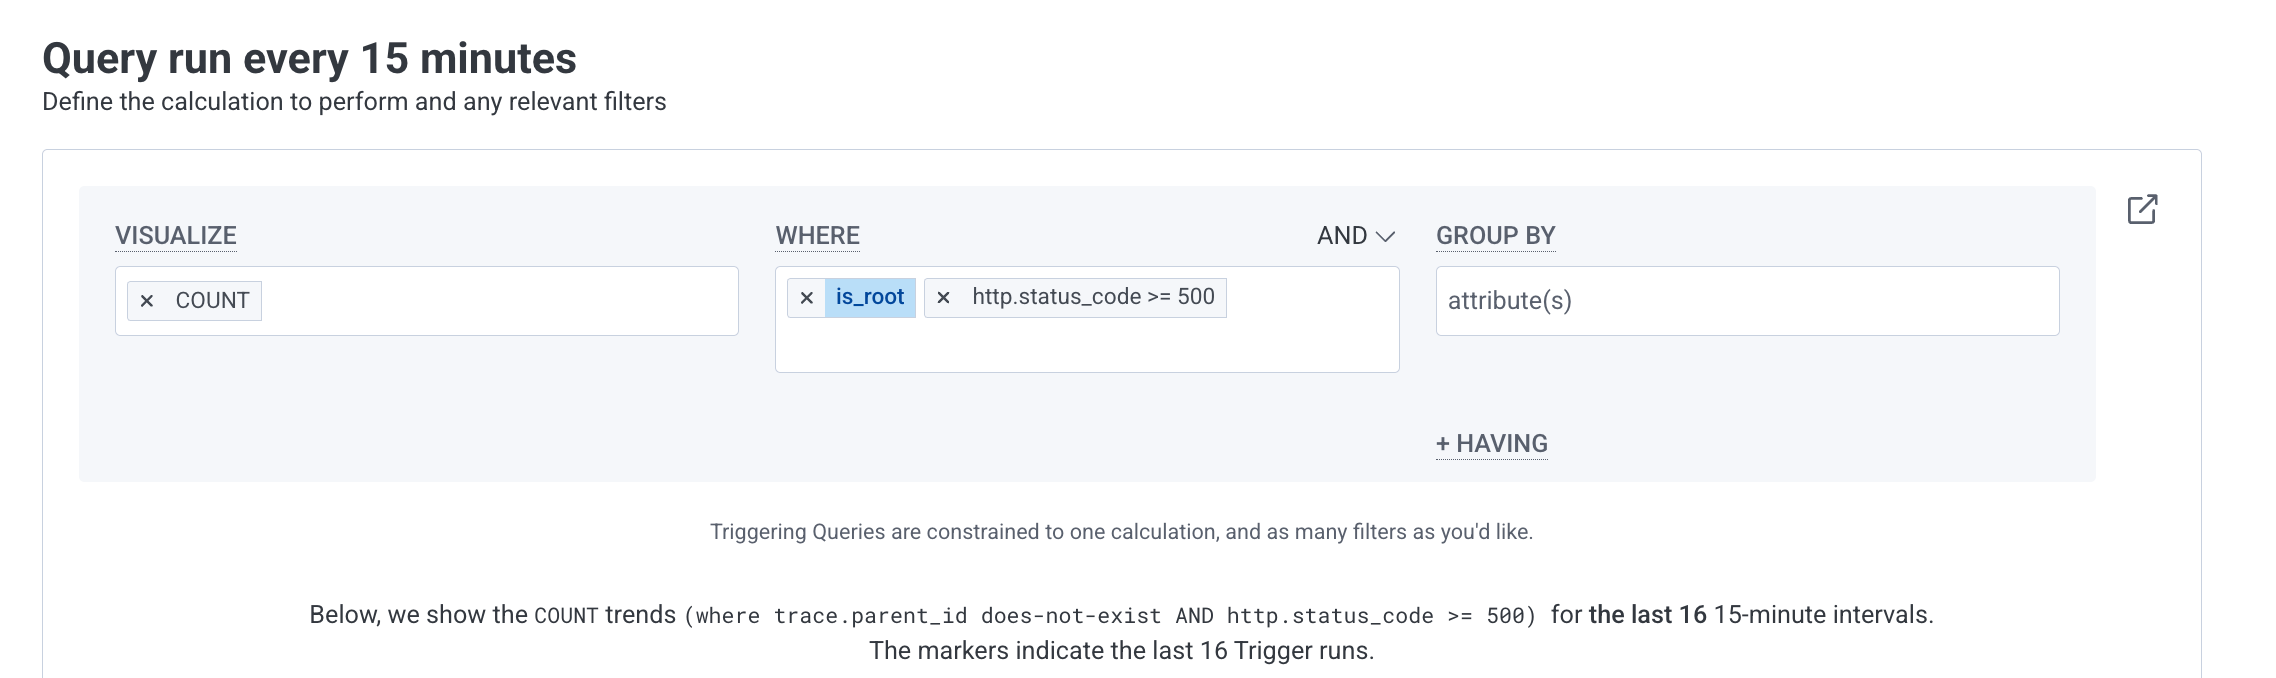
In Honeycomb, alerts are built around triggers - queries that run periodically and notify you when certain conditions are met. In my case, I'm monitoring HTTP 500 errors to catch issues in production. So I've defined a trigger on the Honeycomb UI for that.
Query Configuration: Define WHAT you're monitoring
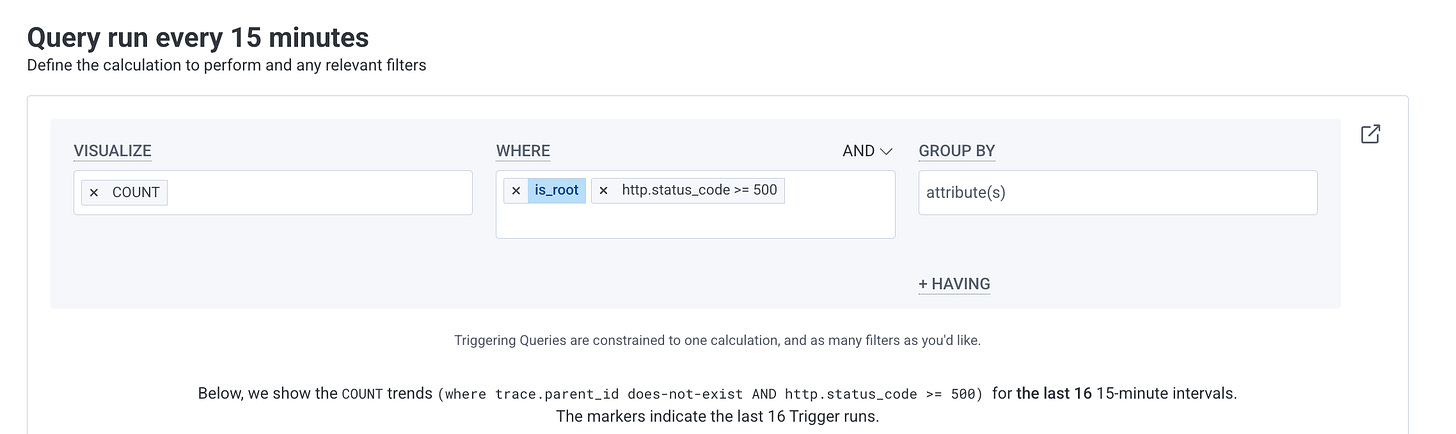
Visualize: COUNT
WHERE:
is_rootANDhttp.status_code >= 500
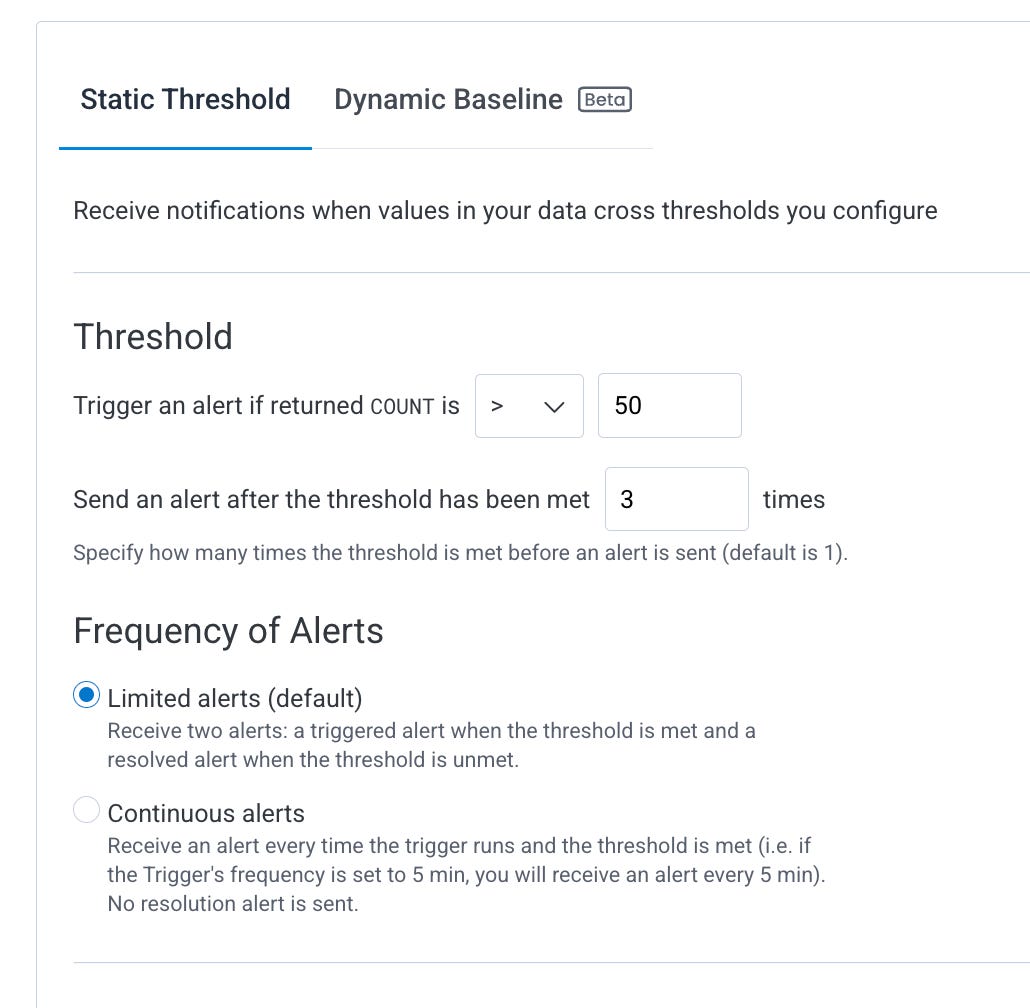
Alert Thresholds: When to trigger
⚠️ These settings will likely have to change after you set up your alert and observe. This is a mix of knowing your system, trial and error, and observing historical patterns. Dynamic baselines can be extremely helpful here if you know what you're doing. Since we don’t know how this app behaves yet, I’ll not go for a dynamic baseline.
Static thresholds (e.g., trigger when COUNT > 0) are good starts, and later you can evolve your alert to use dynamic basicalines
Frequency of alerts is very important - you need to find out what is best for your use case. There's no right or wrong.
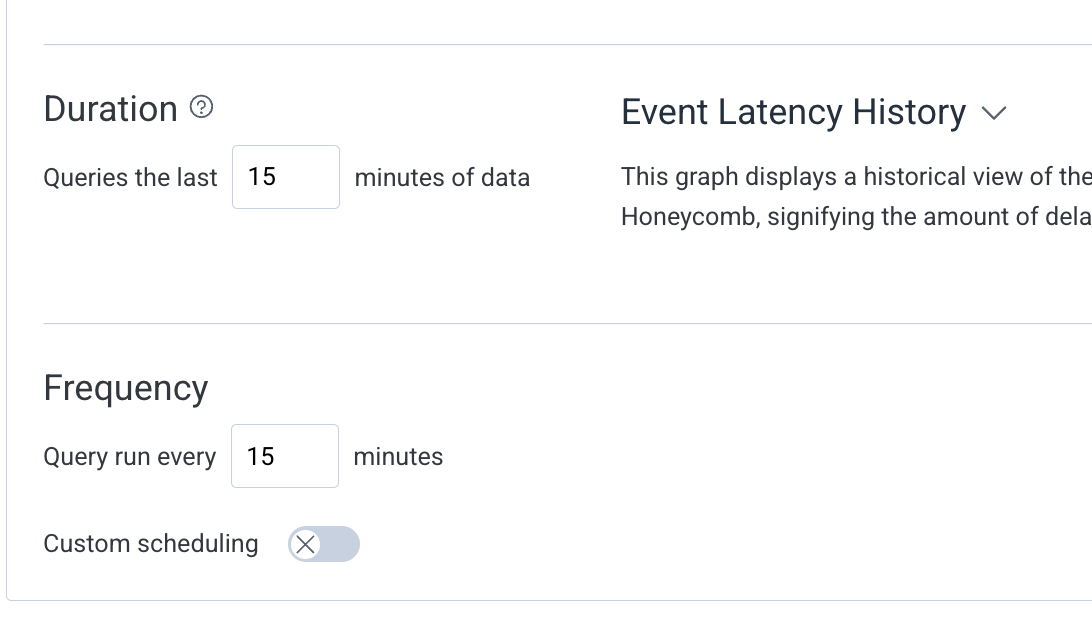
Frequency Settings: How often to check

Query runs every 15 minutes
Looks at the last 15 minutes of data.
This is Honeycomb's UI but many observability tools have similar UIs. We will explore other tools in future posts :)
Common Types of Triggers
For my pet project’s API, I set up alerts for:
Error Rates: Alert when HTTP 500 errors occur
Latency Spikes: Trigger when
AVG(duration_ms) > 500
In the future, I might wanna write up here about how these are not the ideal alerts for a real customer project, where I would prefer to alert on SLO breaches, but for the purpose of this example, this is fine.
Notification Channels
You can route alert triggers to various places
Email
Slack integration
PagerDuty, webhooks, many other tools :)
What I found out with the alerts
Well, this project had been running silently for months, maybe even years. Don't even remember when I deployed it to a first Cloud Run before I migrated it to Railway. So I was surprised it was working so well when I checked once and didn't see any big errors.
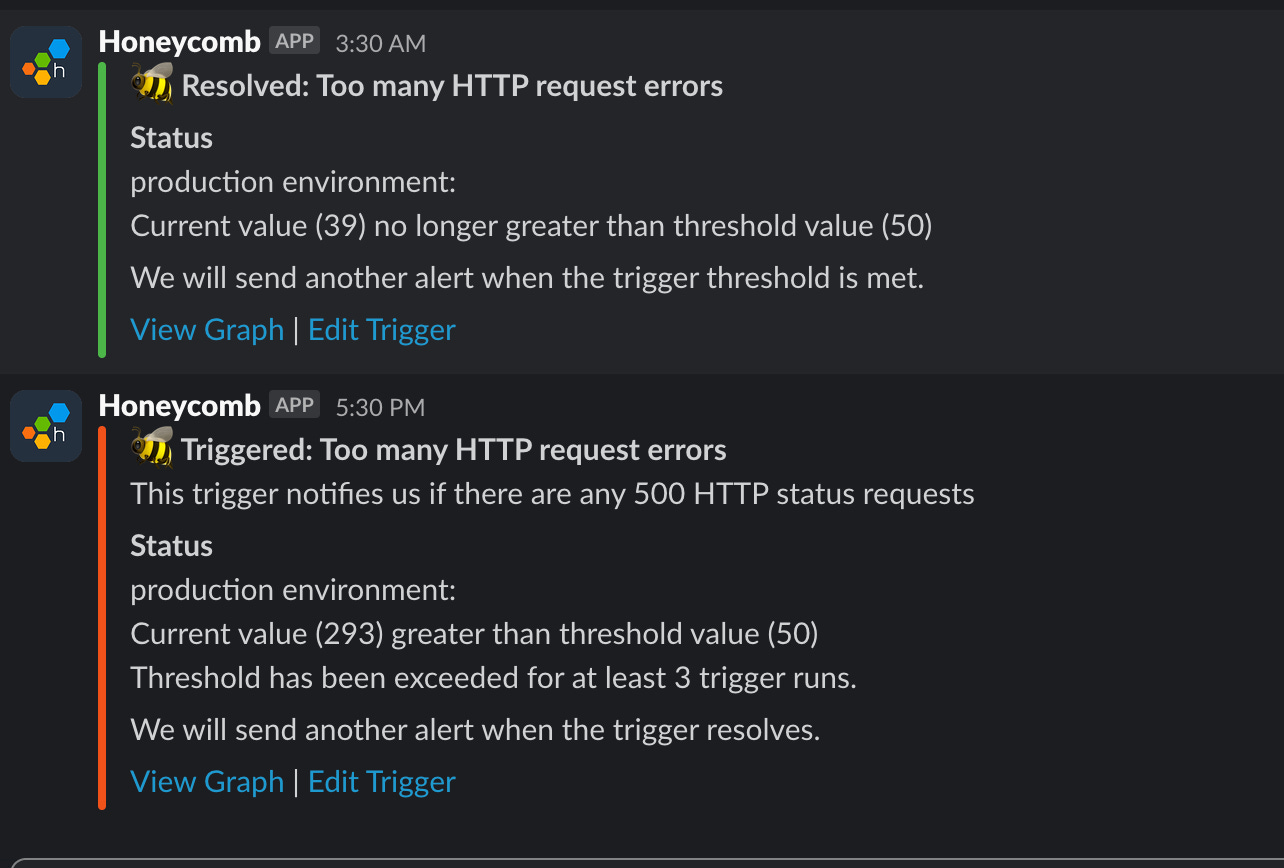
After setting up alerts, though, this little slack channel o’mine got filled with notifications - this would happen at least twice a day.
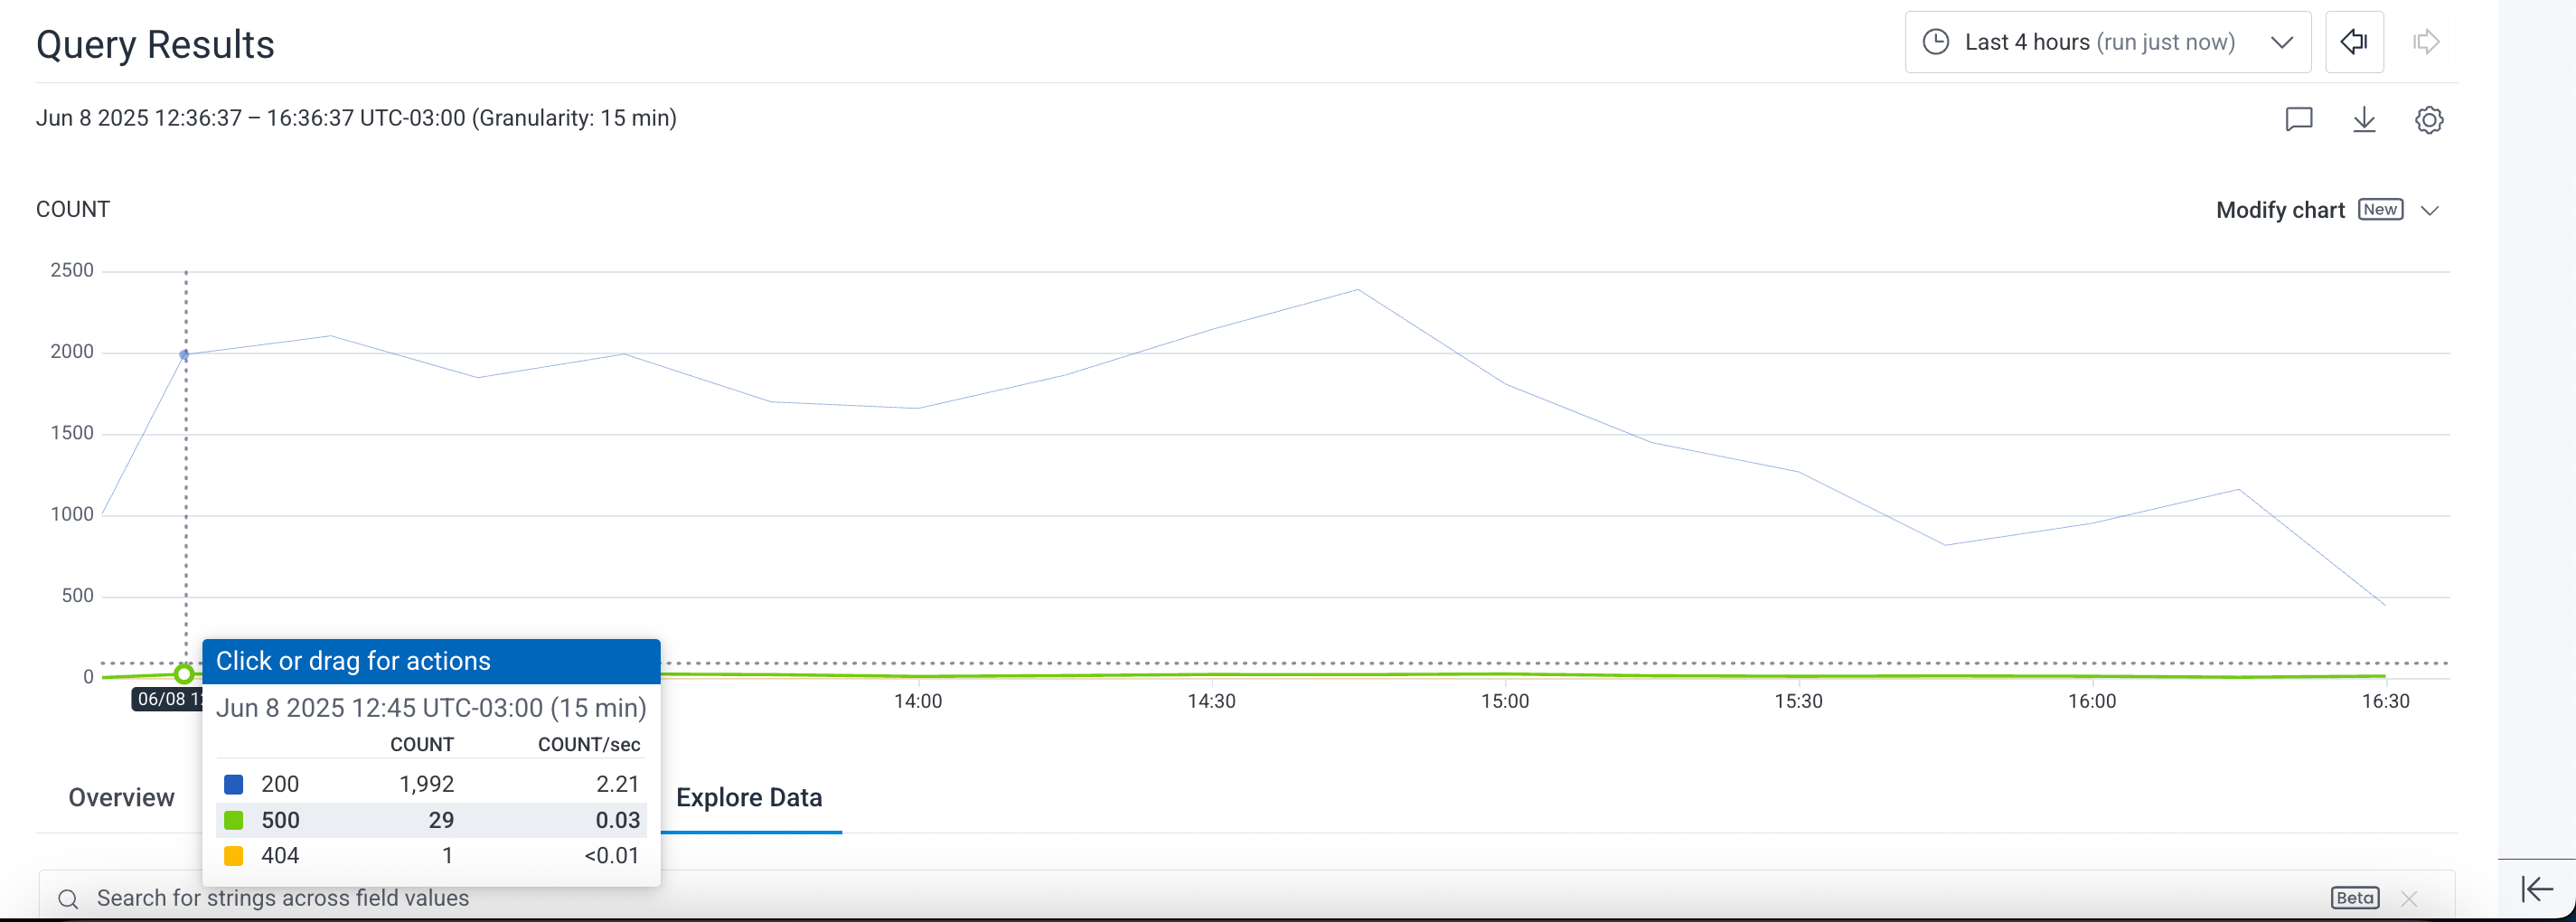
The ratio of 500s to 200s isn’t significant, though!
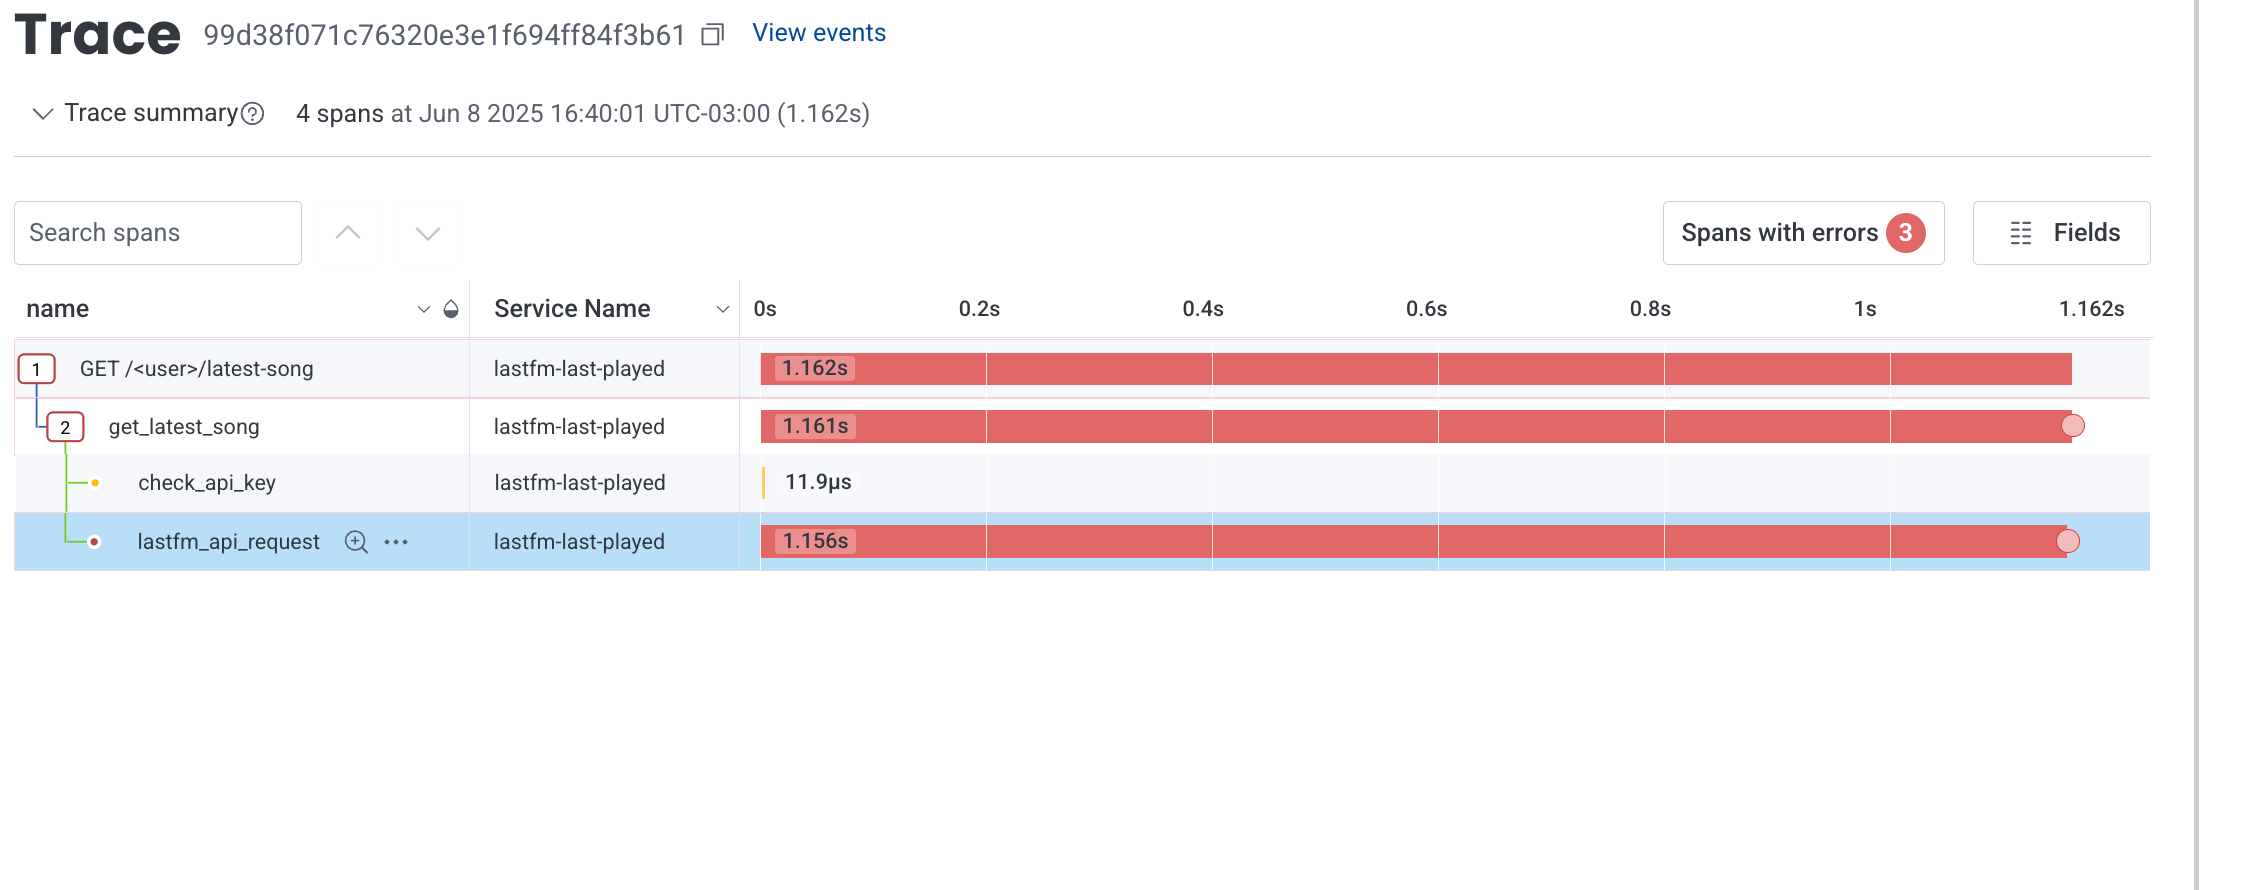
And digging deeper on a trace, it always fails when there is an error I can’t control - an error querying the upstream API.
try:
   # request to upstream API
except requests.exceptions.Timeout:
   # return non generic-error
I went for 504 since I thought it’d be a good status code for when the upstream API doesn’t respond. And now in my alert, I’m going to exclude 504’s - the reason being that I can’t do anything if the upstream API is down in this case. In a more important product, thought, you might wanna create a second alert for these errors - and raise a more specific alert to your team. Not something like “too many errors” but something like “we’re receiving too many errors from the upstream API”. Much easier to debug now :)
Aaaand that is all for today :D Hope it was useful, and stay tuned and subscribe if you liked the content!